

By Mark Patrick, Mouser Electronics
One of the primary considerations for consumers considering purchasing a battery-powered device is how long it will work before recharging. Besides being an essential feature of wearable devices, battery life is becoming increasingly important in the growing number of sensors used in industrial IoT applications. Increasing the time a product can work before recharging isn’t as simple as using a bigger battery because the small dimensions of many of these IoT devices mean they cannot accommodate larger-sized batteries. This makes it essential for embedded engineers to understand the factors affecting the power consumption profile of their devices and time and know how to optimize it. This article discusses the power consumption of IIoT sensors and presents some valuable ways to help engineers to lower it.
Running the World on Batteries
Replacing an exhausted battery in a wireless security sensor or smoke alarm in our home is a relatively straightforward task that doesn’t take too long. Indeed, many such devices send electronic or audible alerts to tell us their battery needs replacing. However, industrial complexes are vastly different from the domestic environment, and replacing batteries in the hundreds of battery-powered sensors distributed across a large site is considerably more onerous. The ‘truck roll’ challenge of driving to the location of each sensor, replacing its battery, and then moving on to the next sensor has become an expensive cost ofIIoT deployment. By understanding when and how their devices consume energy, manufacturers can determine if they could instead be powered using an alternative energy source. For example, energy harvesting techniques can store energy in a supercapacitor. Other potentially usable energy sources include movement (vibration), solar, and heat. An in-depth examination of the device’s power consumption profile and duty cycle will determine if sufficient energy can be harvested and stored to permit regular operation.

Inside aBattery-Powered Sensor
The functional architecture of a typical wirelessly connected, battery-powered temperature and humidity sensor is shown in Figure 1. The architecture is used in many IoT/IIoT devices that measure and report different environmental parameters.

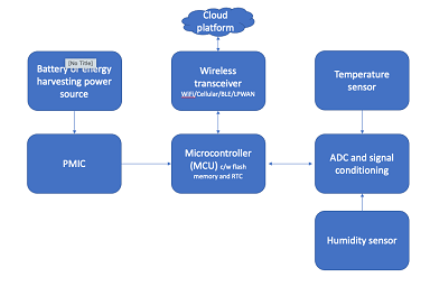
The microcontroller (MCU) in the sensortypically performs the following sequencing of steps:
- Wake up from sleep mode
- Request environmental readings
- Insert the reading into apacket
- Establishes a link to a wireless access point
- Transferring the packet data to a host
- Return the device to sleep mode
The battery voltage is regulated and converted using a power management IC (PMIC), while auxiliary circuits monitor voltage and current levels. Sometimes these readings are also included in the data packet sent to the host application.
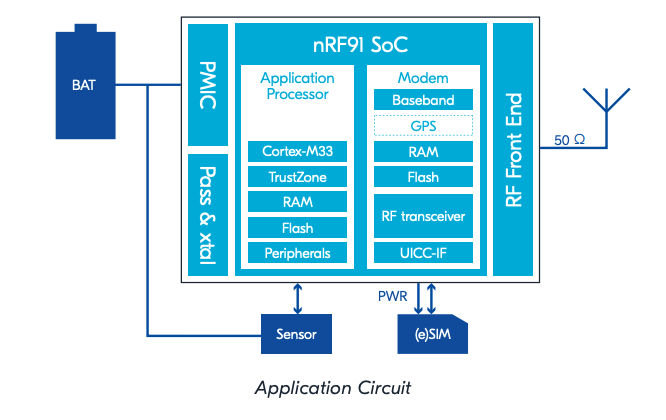
The Nordic Semiconductor nRF9160 cellular system-in-package (SiP) shown in Figure 2 is an example of a highly integrated system-on-chip (SoC) wireless microcontroller which can be used in an IIoT sensor application.

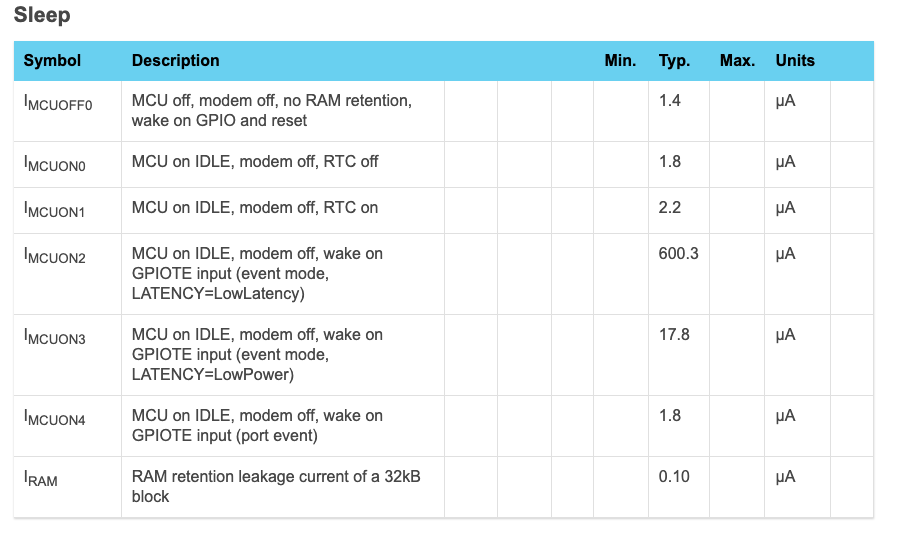
The sensingelements and signal chain are the other components required to complete the IIoT device. The power consumption of the microcontroller and the wireless transceiver acrossdifferent sleep modes is usually listed in its datasheet.Typical current consumption of the nRF9160 MCUin other states (with values ranging from 0.1 µA to 600 µA) is illustrated in Figure 3.

The power consumption of the wireless transceiver can beindependently controlled using embedded firmware,which can ensure it is enabled only when required to transmit data packets. Power consumption can be lowered even further by placing some peripheral components in the MCU in a sleep state simultaneously.
Challenges of Measuring Power Consumption
Understanding how current is consumed in a senorallows an estimate of its battery life.Once a baseline for the average amount of current consumed has been set, several approaches can be attempted to improve the battery life. These include:
- Sequencing the operation of MCU and wireless transceiver
- Placing unused peripherals in low power mode
- Altering the duty cycle of the device
- Investigating different sleep modes
- Reducing the speed of the MCU clock when data is not being processing
Analyzing current with such a high dynamic range is beyond the capabilities of a typical bench Digital Multi-Meter (DMM).An alternative approach is to measure the voltage drop across a shunt resistor, allowing current to be calculated using Ohm’s law. However, the voltage drop across the shunt resistor (the burden voltage) – reduces the load, so for accurate,current measurements (in the order of microamps), the burden voltage must be high enough to be measurable by a DMM but not so high that it affects the behavior by the device under test (DUT). Instantly changing the current in the DUT from the low microamp to the milliamp range further complicates matters; with standard supply rails of 1.8 V or 3.3 V, dynamically changing the burden voltage can result in a brown-out reset of the DUT.
Some precision DMMs are available to perform this type of precise current measurement. Still, these are expensiveand use relay switching to alter the value of the shunt resistor during operation. However, the switching time causes measurement detail and accuracy to be reduced.
Some manufacturers have developed power profiling tools that accurately measure current overa high dynamic range. Examples include theNordic Power Profiler Kit 2 (PPK) and the QoitechOtti Arc.
Power Profiler 2
TheUSB-powered Nordic Semiconductor Power Profiler Kit 2’s measurement capability is between 200 nA to 1 A, with a range-dependent resolution between 100 nA and one mA. It can operate in a source mode (supplying the voltage for the DUT) or an ammeter mode, where it measures current only. The PPK provides a software programmable output voltage from 0.8 VDC to 5 V, up to a maximum of 1 A of current.

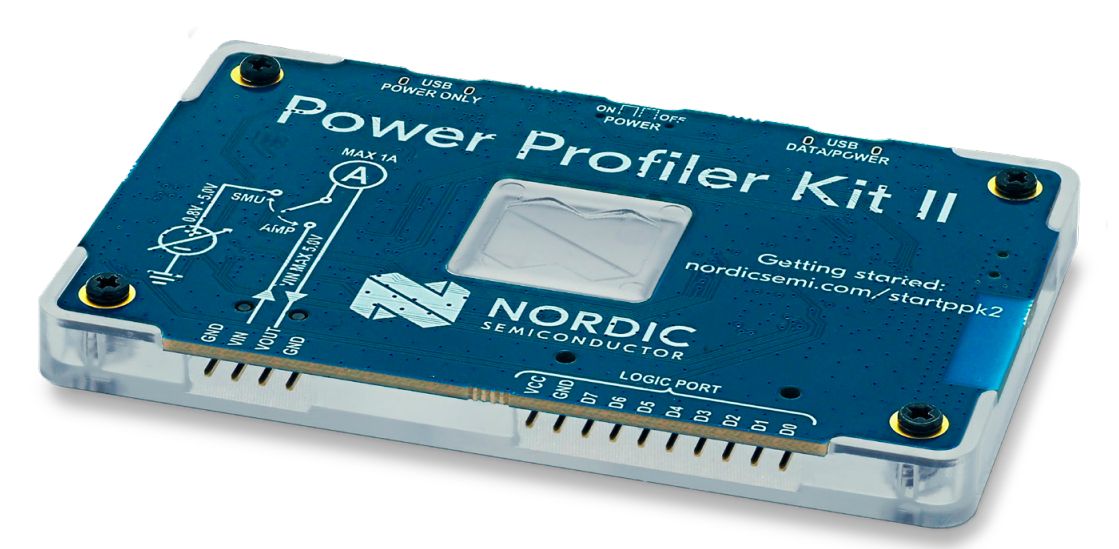
Itcan measure real-time current at a rate of 100 kS/s and maintains optimal resolution by automatically switching between five current measurement ranges to support the optimal resolution.
The PC-based Nordic Power Profiler app connects to the PPK and provides a GUI that can be used to configure the PPK and make measurements. Figure 5 illustrates an example of real-time screen capture.

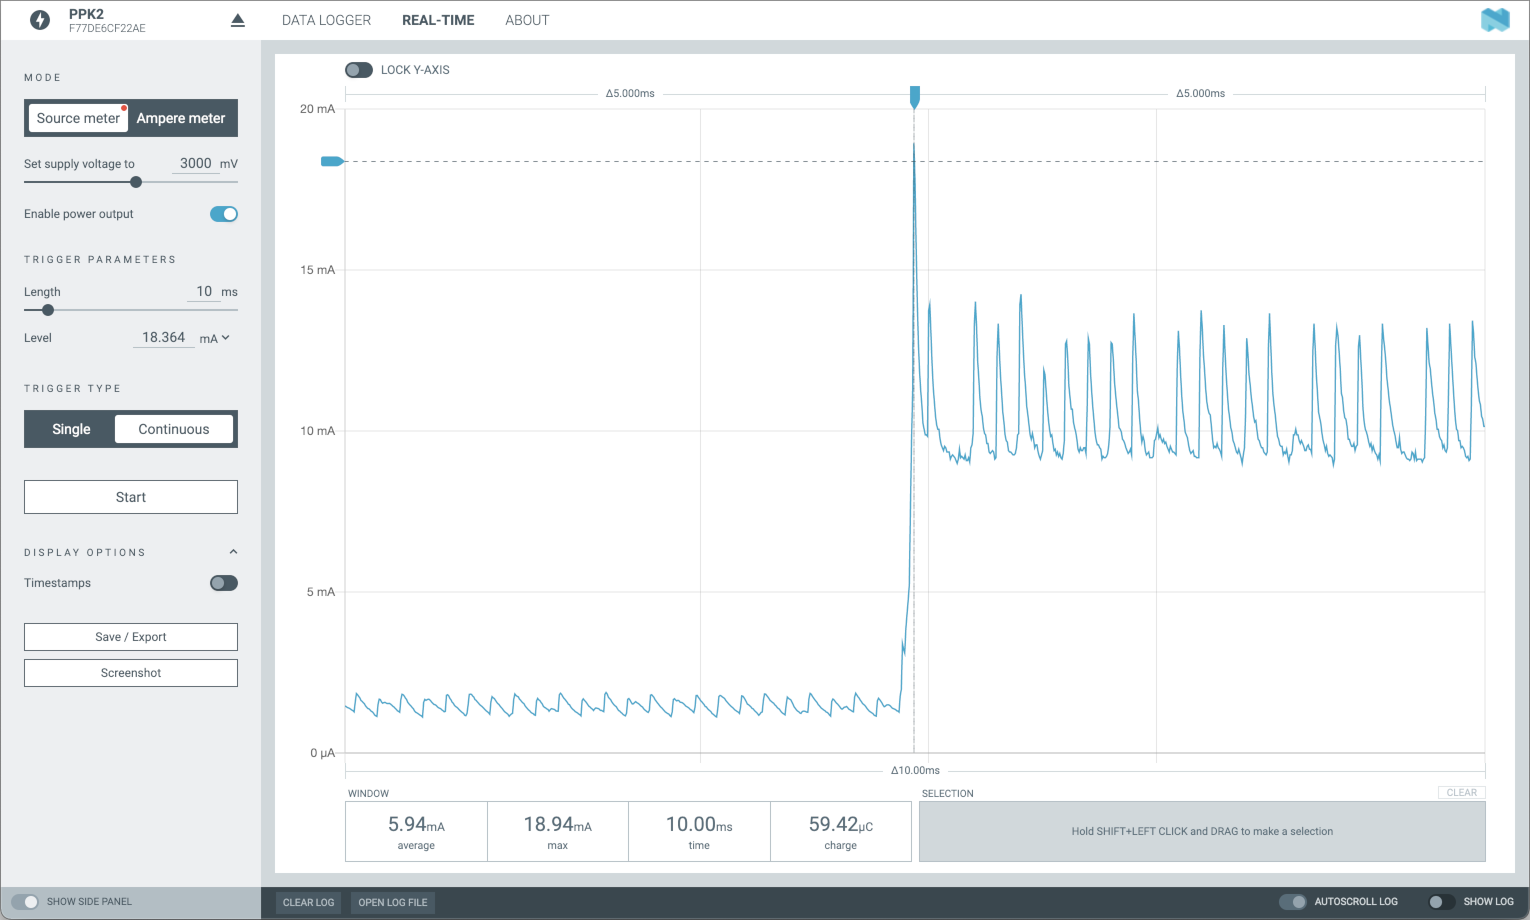
By lowering the sampling resolution from 100 kS/s to 1 S/s, the maximum logging period can be extended from 7 minutes to 500 days.
The PPK2 also has digital GPIO pins that connect sequence control features or a logic analyzer to the DUT.
QoitechOtti
Figure 6 shows the QoitechOtti Arc, a compact and portablepower analyzerthat can measure eight orders of magnitude, with resolutions from tens of nanoamps to 5 A.

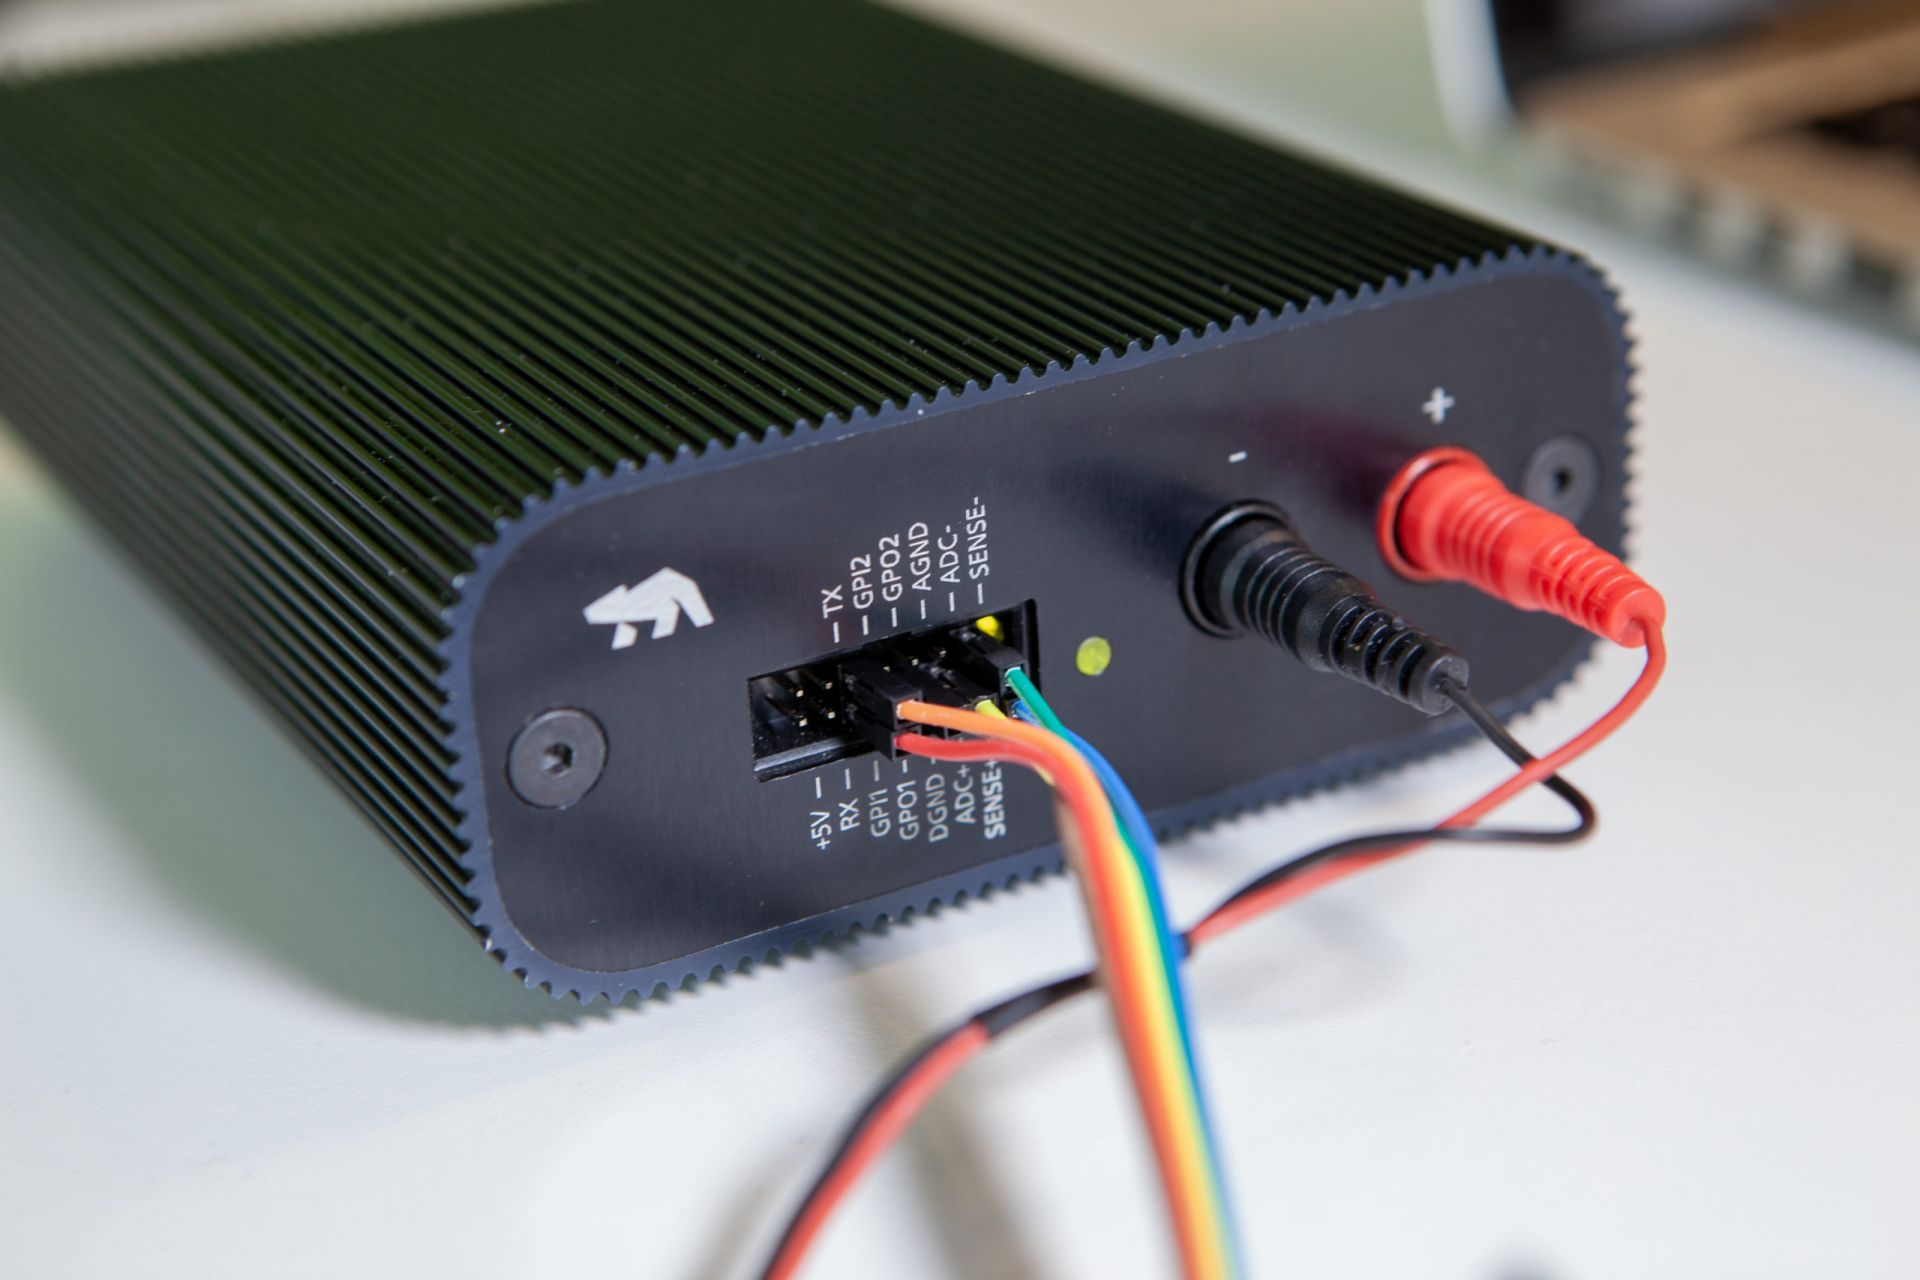
It can be configured as a constant voltage or current source/sink. In current sink mode,it provides a way toemulate and profile different batteries and applications, consuming current up to a maximum of 2.5 A. Its sampling rate is fourkS/s, andit can be powered using an external power supply or from the USB port of the host computer.
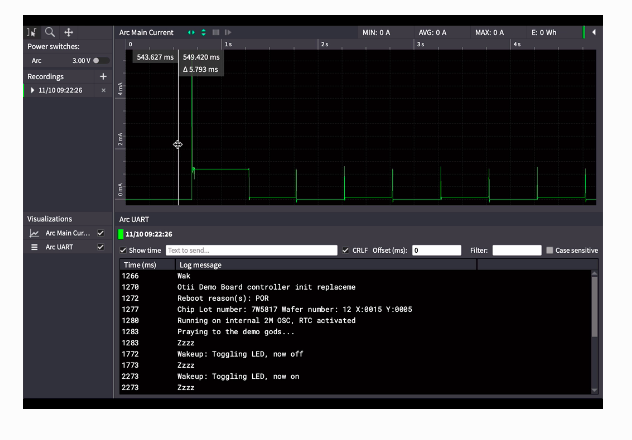
The Otti Arc software includes features that allow it to operate with source or sink current and record the DUT’s current consumption. An example screen capture is shown in Figure 7.

GPIO pins are available to track logical states and control the DUT operation for different types of analysis.
Power Profiling Your Design
Maximizing the battery life of your device requires you to have a complete understanding of its device’s power consumption profile. Knowing the average current consumption will allow you to estimate its battery life, which is affected by performance peaks during regular operation. To optimize the device’s firmware, you need a way to profile the current consumption over complete device cycles of operation. This article has featured two units highlighted that can accurately measure ultra-low current values over a wide dynamic range, and record and plot measured data against a timescale synchronized to the device’s firmware. Detailed information like this can allow embedded developers and hardware engineers to examine firmware code to reveal different ways current peaks can be lowered.
Mouser Electronics
Authorised Distributor
www.mouser.com