Semiconductor for You
  • Home
  • Semiconductor News
  • Semiconductor Magazine
  • Technology
    • Automotive
    • Consumer Electronics
    • IoT
    • Lighting
    • Power Management
    • Wireless
    • Personal Electronics
    • Hardware & Software
    • Research
    • Medical Electronics
    • Embedded Design
    • Aerospace & Defence
    • Artificial Intelligence
  • Interview
  • Industries
  • Market
  • Knowledge Base
  • Events
  • Tools
    • Resistor Color Code Calculator
No Result
View All Result
Semiconductor for You
No Result
View All Result
Home Knowledge Base

Ionosonde and Ionogram: Working Principle, Graph Interpretation, and Ionospheric Layers

Komal Ganvir by Komal Ganvir
April 25, 2026
in Knowledge Base
0

Ionosonde

An ionosonde is an instrument used for monitoring the ionosphere. It is based on the relationship between the frequency of a radio signal and the electron density of the ionosphere, which determines whether the signal will be reflected back to Earth. The ionosonde operates by transmitting successive pulses of radio waves, typically in the frequency range of 2 to 20 MHz, into the ionosphere.

  • If the frequency is suitable, the signal is reflected back.
  • The time taken for the signal to return is measured.
  • This information is used to determine the height and structure of ionospheric layers.

Ionogram

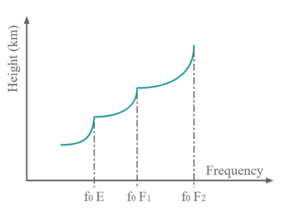
An ionogram is a graphical representation obtained from an ionosonde. It plots time-of-flight (or virtual height) against the transmitted frequency. Each ionospheric layer appears as a smooth curve on the graph. These curves are separated by an asymptote at the critical frequency of each layer.

The initial upward curvature of each layer occurs because the radio wave slows down while passing through ionized regions before being reflected.

  • Critical frequency: Determined from the asymptote of each curve
  • Virtual height: Determined from the lowest point of each curve

Layers Observed in an Ionogram

1. F1 Layer

The F1 layer appears within the F region as an additional layer between two peaks. To distinguish them:

  • The upper layer is called the F2 layer
  • The lower layer is called the F1 layer

2. Sporadic E Layer (Es)

The Sporadic E (Es) layer is an intense but thin ionized layer.

  • It does not extend over a large height range
  • It does not show a clear asymptote due to its sudden formation
  • Strong Es layers can block signals from reaching higher layers (called blanketing)

3. D-Region Absorption

The D-region can absorb radio waves, especially at lower frequencies.

  • This prevents signals from returning to the ground
  • Results in no echoes at the low-frequency end of the ionogram

4. Lacuna

Lacuna refers to gaps in the ionogram caused by atmospheric turbulence.

  • Turbulence disrupts the layered structure of the ionosphere
  • Reflected signals may not return to the receiver
  • The missing portion indicates the height of turbulence

5. Spread-F

Spread-F occurs when signals are reflected from irregular regions of the ionosphere.

  • Normally, reflections occur directly overhead
  • Under certain conditions, signals return from multiple directions
  • This results in a spread or distortion in the ionogram trace

Conclusion

The ionosonde and ionogram are essential tools for studying the ionosphere. They help scientists understand ionospheric structure, detect disturbances, and improve radio communication systems. By analyzing ionograms, it is possible to identify different ionospheric layers and their behavior under varying atmospheric conditions.

Content Protection by DMCA.com
Tags: Ionosonde and Ionogram
Komal Ganvir

Komal Ganvir

Browse by Category

  • Aerospace and Defence
  • Articles
  • Automotive
  • Consumer-Electronics
  • Hardware & Software
  • Interview
  • IoT
  • Knowledge Base
  • Lighting
  • Market
  • personal-electronics
  • Power Management
  • Research
  • Semiconductor Events
  • Semiconductor News
  • Technology
  • Wireless
Semiconductor for You

Semiconductor For You is a resource hub for electronics engineers and industrialist. With its blend of
technology features, news and new product information, Semiconductor For You keeps designers and
managers up to date with the fastest moving industry in the world.

Follow Us

Browse by Category

  • Aerospace and Defence
  • Articles
  • Automotive
  • Consumer-Electronics
  • Hardware & Software
  • Interview
  • IoT
  • Knowledge Base
  • Lighting
  • Market
  • personal-electronics
  • Power Management
  • Research
  • Semiconductor Events
  • Semiconductor News
  • Technology
  • Wireless

Recent News

Solar Effects on Radio Propagation: Solar Flares, Solar Wind, and Communication Impact

Solar Effects on Radio Propagation: Solar Flares, Solar Wind, and Communication Impact

April 25, 2026
Ionosonde and Ionogram: Working Principle, Graph Interpretation, and Ionospheric Layers

Ionosonde and Ionogram: Working Principle, Graph Interpretation, and Ionospheric Layers

April 25, 2026
  • About
  • Advertise
  • Privacy & Policy
  • Contact

© 2022 Semiconductor For You

No Result
View All Result
  • Home
  • Semiconductor News
  • Technology
    • IoT
    • Wireless
    • Power Management
    • Automotive
    • Hardware & Software
  • Market
  • Interview
  • Knowledge Base
  • Tools
    • Resistor Color Code Calculator

© 2022 Semiconductor For You