
Introduction
Spectrum analyzers are important test instruments used to measure frequency-related parameters in electrical and electronic systems. These analyzers are capable of measuring both known and unknown signals with high accuracy. Due to their precision, spectrum analyzers are widely used in the field of electronic measurements, especially for radio frequency (RF) circuits and systems.
Spectrum analyzers are available in various models, sizes, and configurations depending on the application. Modern spectrum analyzers can operate at very high frequencies and can also be connected to computer systems for digital storage and analysis of measurement data.
What is a Spectrum Analyzer?
A spectrum analyzer is a test instrument that measures signal amplitude as a function of frequency. Conventional measuring instruments, such as voltmeters or oscilloscopes, display signals in the time domain. For example, a voltmeter measures voltage amplitude over time, producing a sinusoidal waveform for AC signals or a straight line for DC signals.
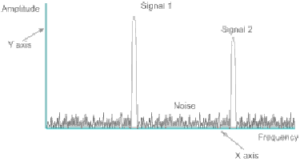
In contrast, a spectrum analyzer displays signals in the frequency domain. It plots signal amplitude on the vertical axis and frequency on the horizontal axis. Strong frequency components appear as high peaks, while noise components appear between the peaks.
Spectrum analyzers are particularly useful for analyzing noise performance and determining the signal-to-noise ratio (SNR) of electronic systems. Many modern applications, such as noise-cancelling headphones, rely on spectrum analysis for testing and optimization.
Block Diagram of Spectrum Analyzer
The block diagram of a spectrum analyzer consists of an input attenuator, low-pass filter, mixer, oscillator, amplifier, and a cathode ray oscilloscope (CRO).
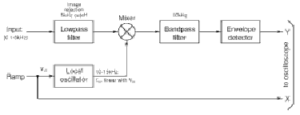
The input attenuator reduces the strength of the incoming RF signal. The attenuated signal is passed through a low-pass filter to remove ripple content. The filtered signal is then mixed with the output of a voltage-tuned oscillator and amplified before being displayed on the CRO. A sweep generator is used to provide horizontal and vertical deflections to the CRO for frequency and amplitude representation.
Working Principle of Spectrum Analyzer
A spectrum analyzer measures the spectral content of a signal applied at its input. For example, if the output of a low-pass filter is connected to the analyzer, it displays the frequency components and noise content of the output signal. The analyzer operates by producing horizontal and vertical sweeps on the CRO. The horizontal sweep represents frequency, while the vertical sweep represents amplitude.
The RF signal is first attenuated using the input attenuator. The signal is then filtered and amplified. It is mixed with the output of a voltage-tuned oscillator, which helps in converting the signal into the frequency domain.
The oscillator output undergoes phase shifting, typically using RC networks or transformers. A ramp generator controls the oscillator frequency to generate the required sweep. The final output is displayed on the CRO, showing amplitude versus frequency.
Types of Spectrum Analyzer
Analog Spectrum Analyzer
Analog spectrum analyzers operate on the superheterodyne principle and are also known as swept or sweep analyzers. These analyzers use separate horizontal and vertical sweep circuits.
A logarithmic amplifier is used to display the output in decibels (dB). A video filter is included to remove unwanted video content. A ramp generator assigns each frequency a specific location on the display, allowing visualization of the frequency response.
Digital Spectrum Analyzer
Digital spectrum analyzers use analog-to-digital converters (ADC) and Fast Fourier Transform (FFT) techniques to analyze signals.
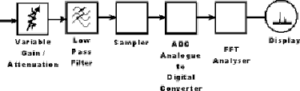
The input signal is first attenuated and filtered. It is then converted into a digital signal using an ADC. The digital signal is processed using FFT to convert it from the time domain to the frequency domain. The resulting frequency spectrum is displayed on the CRO or digital screen.
Advantages and Disadvantages
Advantages
- Measures signal amplitude in the frequency domain
- Accurate analysis of RF signals
- Helps in noise and distortion measurement
- Wide range of measurement capabilities
Disadvantages
- Cost is higher compared to conventional meters
Applications of Spectrum Analyzer
Spectrum analyzers are widely used for testing and analyzing RF signals. Some of the major applications include:
- Signal Level Measurement: Measures signal amplitude in the frequency domain.
- Phase Noise Measurement: Detects phase noise appearing as ripples in the frequency spectrum.
- Harmonic Distortion: Measures total harmonic distortion (THD) to evaluate signal quality.
- Intermodulation Distortion: Analyzes distortion caused by amplitude or frequency modulation.
- Spurious Signal Detection: Identifies unwanted and unknown frequency components.
- Frequency Measurement: Determines frequency content over a wide RF range.
- Spectral Mask Testing: Ensures compliance with communication standards.